 Synapse Group
Fleet management over GPS and CAN
Position, fuel, rpm, engine hours, temperature, speed, braking and geofences read from the vehicle bus, not only from the tracker.
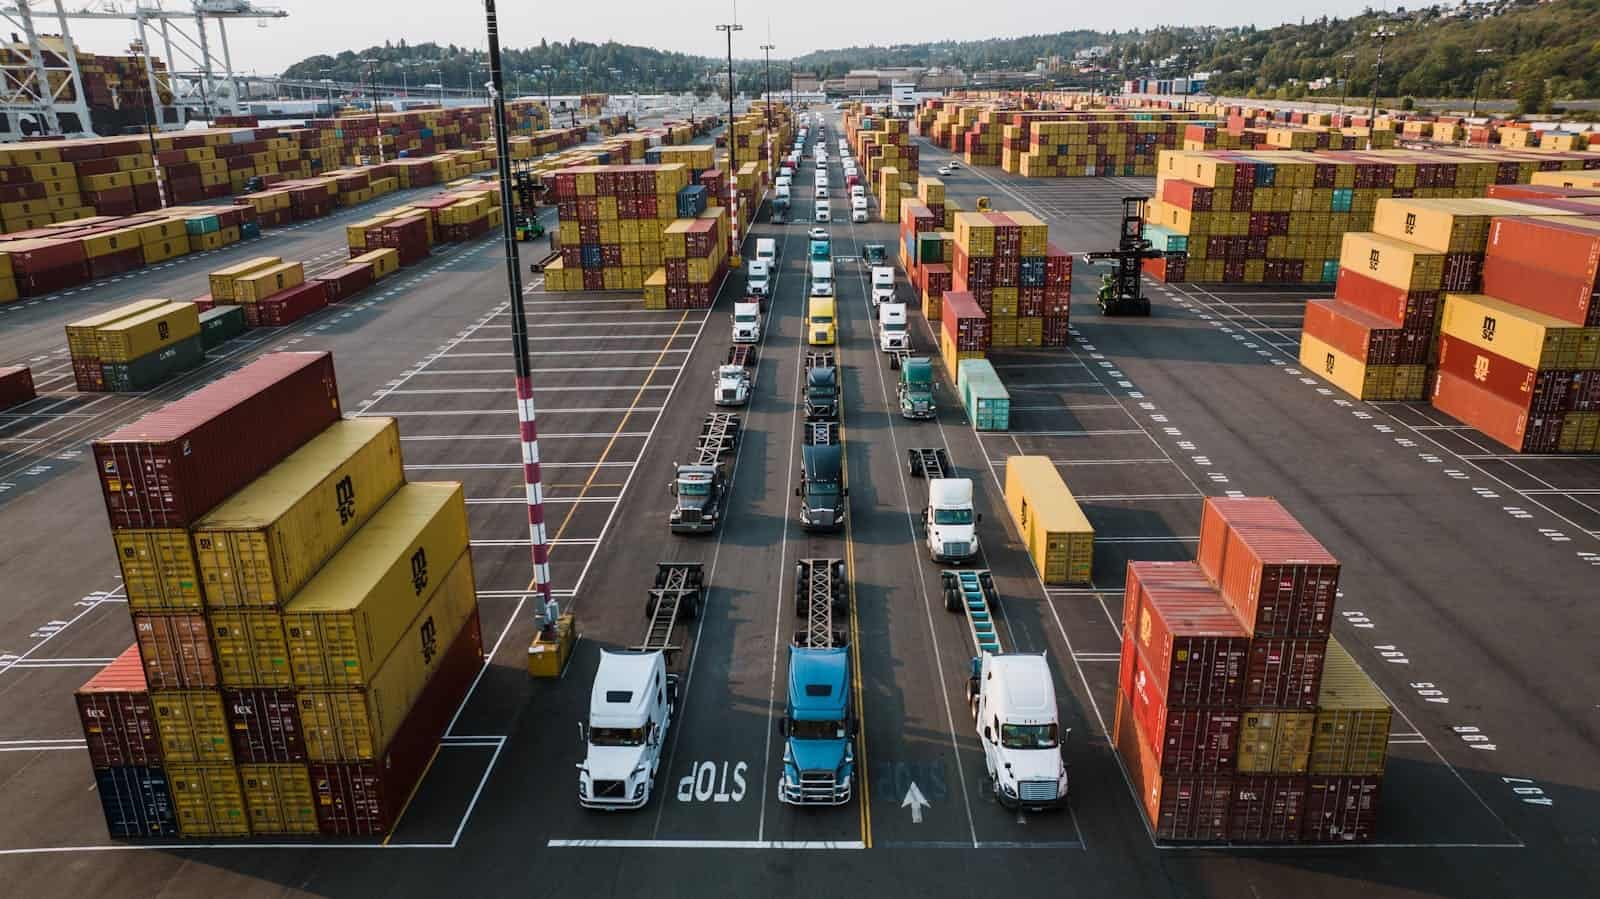
Transport, logistics and ports
Fleet management over GPS and CAN, predictive fleet maintenance, driving video analytics and predictive ETA. For operations where control of moving assets defines the cost.
Sector challenges
Position, yes; the real state of the asset, often not. Without reading the vehicle bus, the fleet is managed on what the driver reports and what the workshop discovers.
92.6%
Share of Chile's foreign trade that moves through the port system, which makes logistics coordination a national problem and not a single company's.
Many fleets already have GPS. The data arrives, accumulates and does not turn into a decision: not a work order, not a conversation with the driver, not a different route tomorrow.
A schedule by kilometre does not distinguish a truck that ran flat from one that climbed loaded all month. The failure shows up on the road, which is where it costs most.
Coordination between carrier, port, customs and client still leans on documents and phone calls. Every manual handoff is an hour of waiting and a piece of data lost.
What is being quoted
This is not a list of what we can do: it is what is being tendered and quoted in this industry right now. If your problem is on it, the conversation starts with context.
Position, fuel, rpm, engine hours, temperature, speed, braking and geofences read from the vehicle bus, not only from the tracker.
Mining trucks, road trucks, buses, heavy machinery and agricultural equipment, with schedules matched to real use rather than to the calendar.
Fatigue, distraction, phone use, pedestrian detection and load monitoring, processed at the edge so it does not depend on the link.
Time windows, slots, consolidation, fleet utilisation and predictive ETA fed by the operation's own history.
APIs, integration between actors and cargo traceability, in line with the port community systems the national logistics policy is driving.
How we work here
GPS, CAN or J1939 bus reading, load and temperature sensors, and cameras when the risk is in the driving rather than in the equipment.
Cellular with local storage, because a fleet crosses areas without coverage and the data cannot be lost on the stretch without signal.
History by vehicle, by route and by driver, integrated with the ERP or TMS so the information reaches where planning happens.
Notice of deviation, idling, harsh braking, critical load condition or fatigue, and maintenance schedules adjusted to measured use.
We start with a bounded pilot, build alongside your operations team and measure what matters. If we propose something, we can also implement it.
What it is measured against
A pilot without a baseline is no basis for a scale-up decision. These are the indicators the work is designed against, measured before starting so there is something to compare with.
Solutions
Condition monitoring on pumps, motors and critical equipment, with the alert wired into maintenance.
View industryMeasurement, connectivity and control of distributed assets, even without grid or coverage.
View industryFrom threshold alarm to event with context, criticality, probable cause and action.
View industryFrequently asked
Instantaneous and cumulative fuel, rpm, engine hours, temperatures, fault codes, throttle and brake position, and estimated load, depending on what the manufacturer exposes over J1939. It is considerably more than GPS position, and it is what turns tracking into predictive maintenance.
Yes, and that is the normal case. What changes between makes is what each bus exposes: we first establish which variables each vehicle provides and normalise them in the platform, so an indicator means the same thing across the fleet.
Yes, with an infrared camera and processing at the edge of the vehicle. Local processing also removes the dependency on the link: the warning to the driver has to happen at the moment, not when the video reaches the cloud.
Yes. API integration is part of the normal scope, because an alert that does not reach the system where planning and invoicing happen ends up being one more screen nobody looks at.
There is no magic number: it depends on what a roadside breakdown costs and how much fuel weighs in the operation. The sensible path is to start with a subset of the fleet, measure against the baseline and scale on that evidence.
Contact
If you have an operational challenge, an innovation project in mind or a question about applying technology to your industry, get in touch.
proyectos@synapsegroup.techWe reply within 48 business hours.
Not ready to talk yet? Take the capabilities brochure: the six fronts we work across, what we build with, and how a project is contracted.